![Image](https://cms.realsavvy.com/attachments/33f4d54bd1470c2ed8d6487ab5531e84bd54fd53/store/8b805bf14ca41416e1c7ab711f93e935ad4541332f83ab2b0eaecfbc21f3/Market+watch+5-11-20.png)
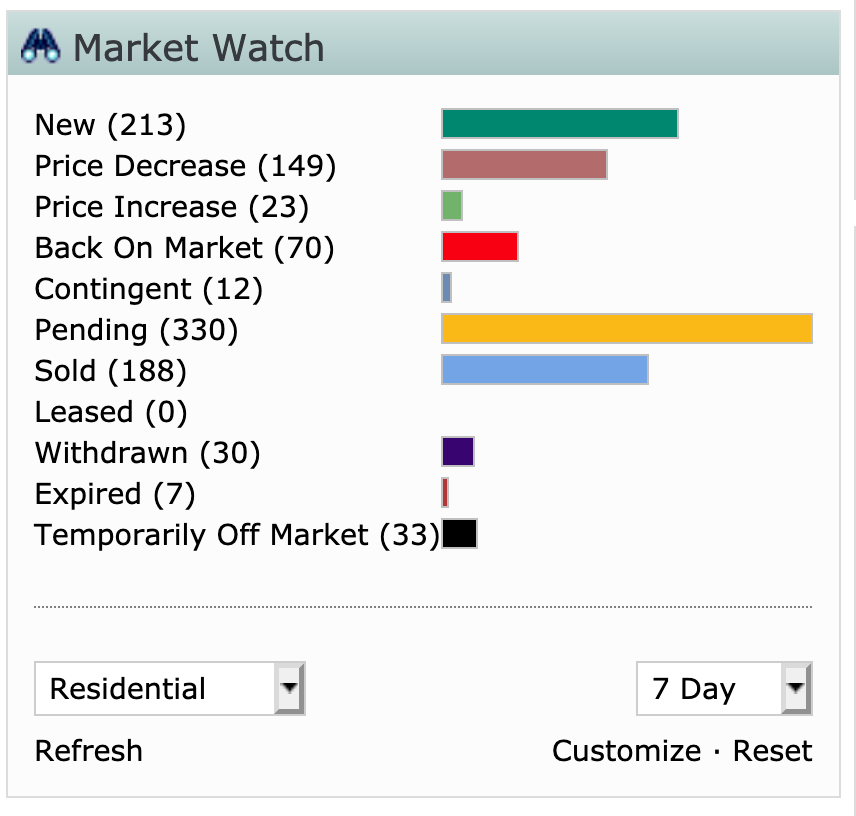
This week's Monday Market Watch May 11th, 2020...The real estate movement for the City of Austin is as follows. New active listings to the market decreased 17%, pending sales are down 4% and the sold properties decreased by 3% this week compared to the week prior. The number of sold properties is about 43% lower than the same time last year. Watch the video below for details.
We continue in a seller's market for all price points. However, the $1,000,000 and over properties are approaching neutral status with 5.4 months inventory. Six months is considered a stable market.
![](https://buildercdn.locomotivecms.com/attachments/6f1a62d921af698950b22a8bc15258091b69debc/store/4f196b5704df97afa83b76872822f16d1100f5fe1ccf1481315f8af60fe9/Market+Watch+graph+5-11-20.png)
Year over Year Statistics for the City of Austin...
![](https://buildercdn.locomotivecms.com/attachments/94ba6b0bafe595d2c5675d9238dfc9792d40b781/store/f4f95238cf4a5f6f199a131c0642e8d59fb91b095ae67d88f324f24ef7f3/5-11+average+sale+price.png)
![](https://buildercdn.locomotivecms.com/attachments/c57050afd9c16a61d51be4d27e6019310267869e/store/2b5162ea63d7e22b4a1fcb53dbfd6602d01f6ef5cd8ebf9ee41a8a62c72e/5-11+average+list+price.png)
![](https://buildercdn.locomotivecms.com/attachments/bf05abf8c6bb40b57a37197105b40ccb5840d6d6/store/31a4cb9e4a4a617995310730ce1e2dd23c6a347e3fcf1c1e98b76863fa02/5-11+number+of+sales.png)
![](https://buildercdn.locomotivecms.com/attachments/4bd49e23ac90bdf7f67ee220b5c52ebb661caccd/store/e6ecbff96c6ccdcd90ecd12eb4d4955e5714200d083fb25171c06afe67e8/5-11+median+days+on+market.png)